
BEKASI, WEST JAVA, INDONESIA. APRIL 1, 2020 : Canva: Graphic Design dev application on Smartphone screen. Flyers, Logos, Posters is a freeware web browser developed by Canva
Коллекция по умолчанию
Коллекция по умолчанию
Создать новую
Kharkov, Ukraine - February 5, 2021: close up Wizzair application on Apple smartphone, Hungary airlines app background, creative flat lay banner for traveler
Коллекция по умолчанию
Коллекция по умолчанию
Создать новую
Paris, France - Apr 16, 2020: Woman looking on Apple Computers internet website on iPad Pro tablet in room environment showcasing new iPhone SE specifications
Коллекция по умолчанию
Коллекция по умолчанию
Создать новую
iPhone displaying the Instagram logo. Social media. Instagram is a photo-sharing app for smartphones. Moscow, Russia - March 26, 2019
Коллекция по умолчанию
Коллекция по умолчанию
Создать новую
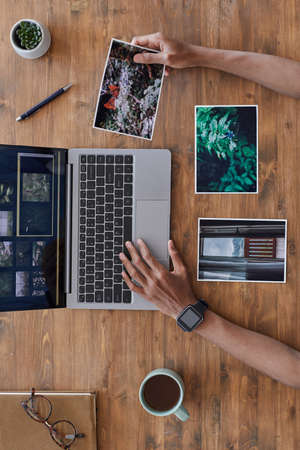
Minimal background composition of male hands holding printed photographs and using laptop on textured wooden desk, photographers office, copy space
Коллекция по умолчанию
Коллекция по умолчанию
Создать новую

Kazan, Russia - Oct 6, 2021: Etsy is an American e-commerce company focused on handmade items and craft supplies. A smartphone with the Etsy logo in a hand.
Коллекция по умолчанию
Коллекция по умолчанию
Создать новую
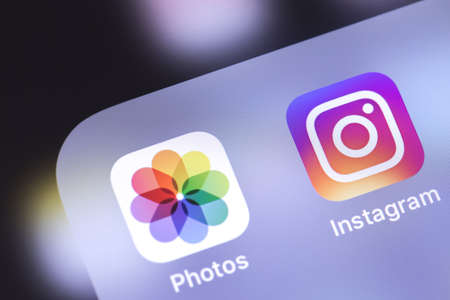
Apple iPhone displaying the Photos app and Instagram app. Instagram is a photo-sharing app for smartphones. Moscow, Russia - March 1, 2019
Коллекция по умолчанию
Коллекция по умолчанию
Создать новую
New York, USA - 15 May 2020: Neon Capture Analyze mobile app logo on phone screen, close-up icon, Illustrative Editorial.
Коллекция по умолчанию
Коллекция по умолчанию
Создать новую
Pinterest. Smartphone in male hand on Pinterest smartphone screen on blue, yellow, black background. July 2020. Kiev, Ukraine.
Коллекция по умолчанию
Коллекция по умолчанию
Создать новую
Lod, Israel - July 8, 2020: Adobe Behance app launch screen with logo on the display of a black mobile smartphone isolated on white background. Top view flat lay with copy space.
Коллекция по умолчанию
Коллекция по умолчанию
Создать новую
KHARKOV, UKRAINE - MARCH 5, 2021: Instagram icon and application from App store on iPhone 12 pro display screen with airpods pro on white wooden table
Коллекция по умолчанию
Коллекция по умолчанию
Создать новую
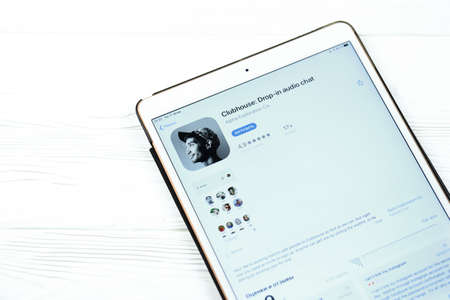
Clubhouse application view on the smartphone, controversy 2021 that hides behind the Social app. Clubhouse drop in audio chat application view on the smartphone
Коллекция по умолчанию
Коллекция по умолчанию
Создать новую
Los Angeles, California, USA - 25 January 2020: Instagram logo icon on purple background, Illustrative Editorial.
Коллекция по умолчанию
Коллекция по умолчанию
Создать новую

Moscow, Russia - 15 November 2020: Myspace home page browsing through glasses, company logo. High quality photo
Коллекция по умолчанию
Коллекция по умолчанию
Создать новую
instagram application icon on Apple iPhone 13 Pro, smartphone with IG instagram logo on the screen popular social media network : Bangkok, Thailand - June 3 2022
Коллекция по умолчанию
Коллекция по умолчанию
Создать новую
pile of photo slides on the blue background - closeup
Коллекция по умолчанию
Коллекция по умолчанию
Создать новую
Barcelona, Spain - 20 april 2021: a mobile phone with Game On application open on white background. Game on is a popular application for mobile gamers
Коллекция по умолчанию
Коллекция по умолчанию
Создать новую
02-24-2021 Portsmouth, Hampshire, UK A mobile phone or cell phone on a wooden table with the OS maps app open next to a coffee and glasses
Коллекция по умолчанию
Коллекция по умолчанию
Создать новую
Lod, Israel - July 8, 2020: Adobe Lightroom - Photo Editor & Pro Camera app play store page on the display of a black mobile smartphone isolated on white background. Top view flat lay with copy space.
Коллекция по умолчанию
Коллекция по умолчанию
Создать новую
Zoom app logo on the screen smartphone. Zoom Video Communications is a company that provides remote conferencing services. Cup of coffee on a wooden table.
Коллекция по умолчанию
Коллекция по умолчанию
Создать новую
SpaceX company homepage website close-up view. Business and exploration concept background photo
Коллекция по умолчанию
Коллекция по умолчанию
Создать новую

Top view of breakfast menu on white dining table.Coffee,milk, cereal, apple,cracker and bun on white table view from top.Food lay flat concept.
Коллекция по умолчанию
Коллекция по умолчанию
Создать новую
02-24-2021 Portsmouth, Hampshire, UK A mobile phone or cell phone on a wooden table with the Portify app open next to a coffee and glasses
Коллекция по умолчанию
Коллекция по умолчанию
Создать новую

Tver, Russia-April 9, 2020, The tik tok logo on a smartphone screen on yellow background with donats. Tik-Tok icon. the tick Tok app. Tiktok social network. Space for text.
Коллекция по умолчанию
Коллекция по умолчанию
Создать новую

CHIANG MAI, THAILAND - AUG 26, 2020: A woman holds Apple iPhone X with Instagram application on the screen at cafe. Instagram is a photo-sharing app for smartphones.
Коллекция по умолчанию
Коллекция по умолчанию
Создать новую
Barcelona, Spain - 13 october 2021: the Roblox app is seen on the screen of a mobile phone hold by hand. Roblox is an online metaverse app
Коллекция по умолчанию
Коллекция по умолчанию
Создать новую
people getting information from social media network where they provide interests and engagement pragma
Коллекция по умолчанию
Коллекция по умолчанию
Создать новую
USA - May, 2020; Burger King Iphone Screen on colored background. #FastFood
Коллекция по умолчанию
Коллекция по умолчанию
Создать новую
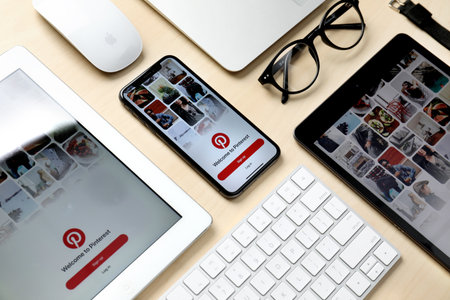
Young woman holding a smartphone with Pinterest app on screen. IPhone 11 with a social media app logo for interesting and exceptional content.
Коллекция по умолчанию
Коллекция по умолчанию
Создать новую
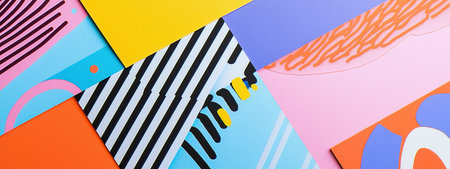
Bold geometric patterns and neon accents create a vibrant visual experience
Коллекция по умолчанию
Коллекция по умолчанию
Создать новую
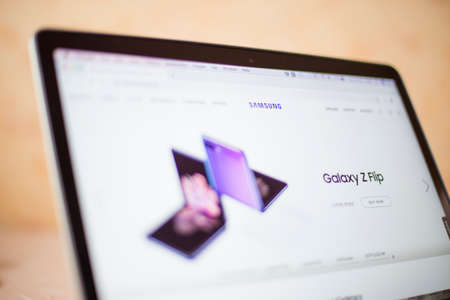
BELGRADE, SERBIA - MARCH 9, 2020: Samsung web site on computer screen. Samsung is a South Korean multinational conglomerate founded at 1938.
Коллекция по умолчанию
Коллекция по умолчанию
Создать новую
MYKOLAIV, UKRAINE - AUGUST 27, 2020: Composition with iPhone 11 and iPad tablets on wooden table
Коллекция по умолчанию
Коллекция по умолчанию
Создать новую
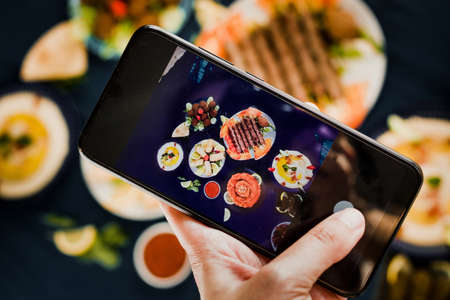
Cellphone with food picture for social media.
Коллекция по умолчанию
Коллекция по умолчанию
Создать новую
New York, USA - 26 October 2020: SATS mobile app logo on phone screen close up, Illustrative Editorial.
Коллекция по умолчанию
Коллекция по умолчанию
Создать новую
London - September 13, 2018: Apple Computers internet website on 15 inch 2018 MacBook Retina in room environment showcasing iPhone Xs Max R Keynote in Cupertino aperture setting on photo
Коллекция по умолчанию
Коллекция по умолчанию
Создать новую
CHIANG MAI ,THAILAND JUL 27 2019 : Woman hand holding iPhone Xs with Spotify login screen. Spotify is a music service that offers legal streaming music.
Коллекция по умолчанию
Коллекция по умолчанию
Создать новую
Helsinki, Finland, January 30, 2020: Snapchat application icon on Apple iPhone 11 smartphone screen close-up in woman hands. Snapchat app icon. Social media icon. Social network
Коллекция по умолчанию
Коллекция по умолчанию
Создать новую
Hinge logo of dating application on the screen of mobile phone in males hand, June 2021, San Francisco, USA
Коллекция по умолчанию
Коллекция по умолчанию
Создать новую

Florianopolis, Brazil, July 13, 2019: close-up of a man hand holding Pokemon Cards. Brazilian youths perform battles using these collectibles cards.
Коллекция по умолчанию
Коллекция по умолчанию
Создать новую
USA - May, 2020; Nike Iphone Application Screen on colored paper background. Nike is an American multinational corporation. #Nike
Коллекция по умолчанию
Коллекция по умолчанию
Создать новую
Helsinki, Finland, January 30, 2020: Amazon Prime Video application icon on Apple iPhone X screen close-up. Amazon PrimeVideo app icon. Amazon Prime application. Social media network
Коллекция по умолчанию
Коллекция по умолчанию
Создать новую

Collage of growth metrics and office themes showcasing a blend of playful and professional design
Коллекция по умолчанию
Коллекция по умолчанию
Создать новую
BELGRADE, SERBIA - MARCH 9, 2020: Kylie Cosmetics web site on computer screen. It is an American cosmetics company founded by Kylie Jenner founded at 2015.
Коллекция по умолчанию
Коллекция по умолчанию
Создать новую

Kharkov, Ukraine - February 22, 2021: FedEx app logo of shipping company displayed on Apple smartphone screen, creative composition, copy space photo
Коллекция по умолчанию
Коллекция по умолчанию
Создать новую
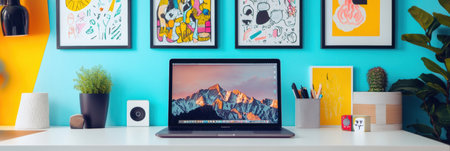
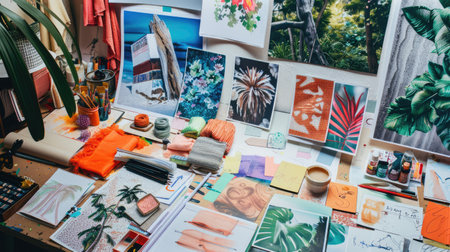
A well-organized desk displays a laptop surrounded by vibrant wall art, plants, and office supplies, creating an inspiring workspace.
Коллекция по умолчанию
Коллекция по умолчанию
Создать новую

McDonalds domain name in browser and logo on the computer screen. Editorial macro shot
Коллекция по умолчанию
Коллекция по умолчанию
Создать новую

Contemporary art collage. Beautiful young. Copy space for text, ad. Flyer. Modern artwork.
Коллекция по умолчанию
Коллекция по умолчанию
Создать новую
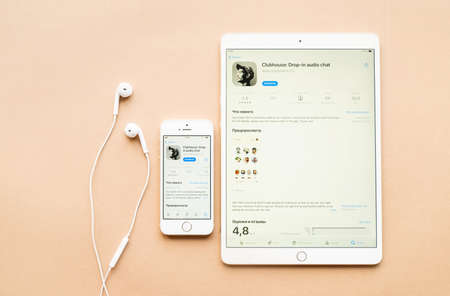
KHARKOV, UKRAINE - FEBRUARY 14, 2021: Clubhouse app in app store market on ipad display screen. Clubhouse is invitation only audio chat iPhone app launched in April 2020
Коллекция по умолчанию
Коллекция по умолчанию
Создать новую
New York, USA - 9 April 2020: Shutterstock website on laptop screen close up. Man using service on display, blurry background, Illustrative Editorial.
Коллекция по умолчанию
Коллекция по умолчанию
Создать новую
MIAMI, USA - 07.07.2019: A man holds a smartphone in his hand with the Instagram logo on the screen
Коллекция по умолчанию
Коллекция по умолчанию
Создать новую
Lod, Israel - July 8, 2020: Modern minimalist office workspace with black mobile smartphone with Autodesk SketchBook app play store page on a white background. Close up top view flat lay.
Коллекция по умолчанию
Коллекция по умолчанию
Создать новую
Estate Planning write on a book isolated wooden table.
Коллекция по умолчанию
Коллекция по умолчанию
Создать новую
New York, USA, July 2021: A hand holding a phone with the Peloton app on the screen isolated on a white background. Peloton is an American exercise equipment based in New York
Коллекция по умолчанию
Коллекция по умолчанию
Создать новую
Minsk, Belarus - November 06, 2019: Tencent QQ application on smartphone. The most popular messenger in China
Коллекция по умолчанию
Коллекция по умолчанию
Создать новую
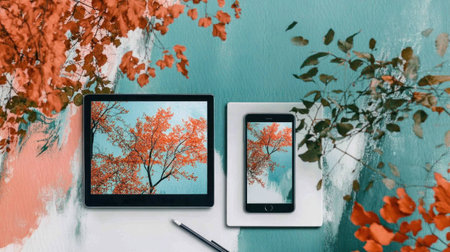
Autumn inspired flat lay with digital devices showcasing vibrant orange leaves against a teal background, perfect for seasonal marketing and design concepts
Коллекция по умолчанию
Коллекция по умолчанию
Создать новую

A creative team brainstorming around a table covered with printed graphics, design drafts, and mood boards, with a focus on collaborative planning.
Коллекция по умолчанию
Коллекция по умолчанию
Создать новую
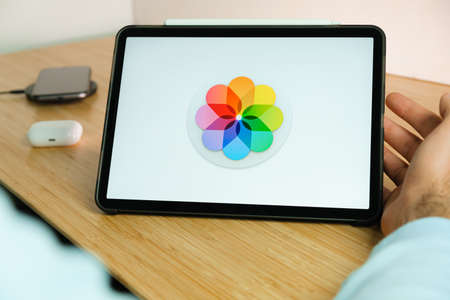
Apple Photos logo on the screen of iPad tablet. March 2021, San Francisco, USA
Коллекция по умолчанию
Коллекция по умолчанию
Создать новую
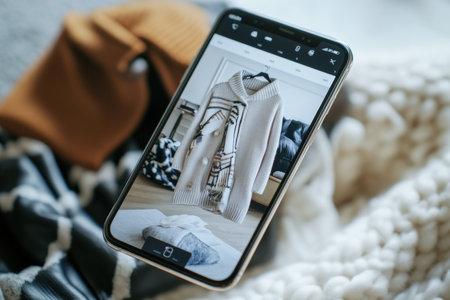
A smartphone displays a stylish sweater while nestled among cozy textiles. This digital shopping experience invites users to explore trendy clothing options at their convenience.
Коллекция по умолчанию
Коллекция по умолчанию
Создать новую

Los Angeles, California, USA - 5 December 2019: TikTok app icon on phone screen in blue jeans pocket. App Store logo on Iphone with light denim Background, Illustrative Editorial.
Коллекция по умолчанию
Коллекция по умолчанию
Создать новую

Laptop showing Zoom Cloud Meetings app logo. Work and have meetings from home.
Коллекция по умолчанию
Коллекция по умолчанию
Создать новую
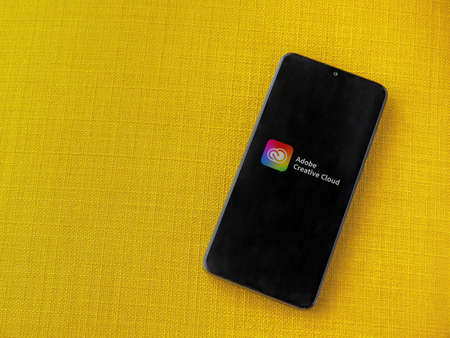
Lod, Israel - July 8, 2020: Adobe Creative Cloud app play store page on the display of a black mobile smartphone on a yellow fabric background. Top view flat lay with copy space.
Коллекция по умолчанию
Коллекция по умолчанию
Создать новую

A fusion of pictures and fabrics on a wall creates a stunning collage of art. Electric blue petals, flowers, and paper products add a unique touch to the facade AIG50
Коллекция по умолчанию
Коллекция по умолчанию
Создать новую
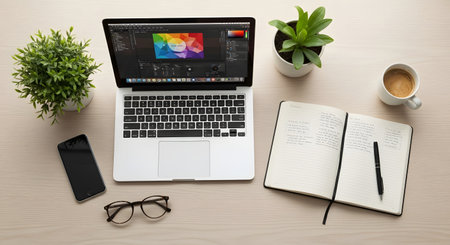
A top-down view of a modern desk setup featuring a laptop, open notebook, eyeglasses, coffee, and potted plants.
Коллекция по умолчанию
Коллекция по умолчанию
Создать новую
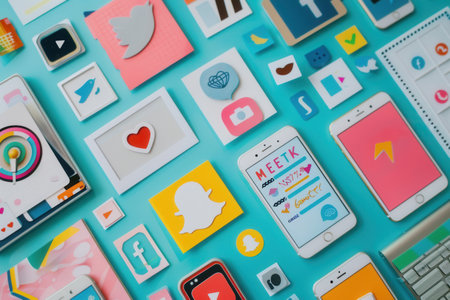
Colorful social media ads and announcements displayed on turquoise background, great for advertising agencies and marketers to showcase their work in a flat lay.
Коллекция по умолчанию
Коллекция по умолчанию
Создать новую

02-15-2021 Portsmouth, Hampshire, UK A mobile phone or cell phone laid on a wooden table with the XBOX app open on screen
Коллекция по умолчанию
Коллекция по умолчанию
Создать новую
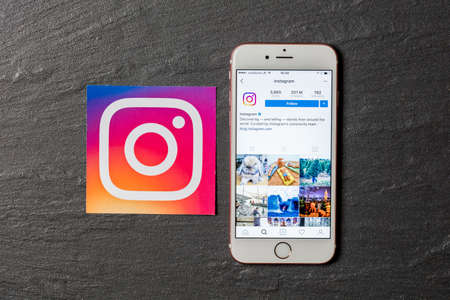
OXFORD, UK, DEC 5 2016: Smartphone shows the instagram app with instagram logos
Коллекция по умолчанию
Коллекция по умолчанию
Создать новую

Blooming Serenity: Capturing White Flowers on a Polaroid Tree Canvas
Коллекция по умолчанию
Коллекция по умолчанию
Создать новую
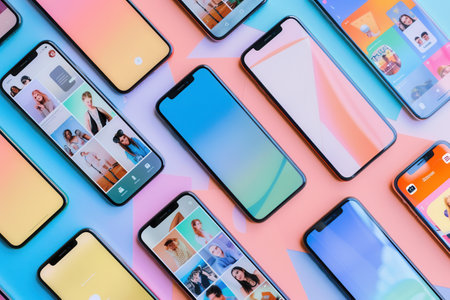
A collection of smartphones showcases various open stories and short videos on vibrant, colorful backgrounds, illustrating digital engagement.
Коллекция по умолчанию
Коллекция по умолчанию
Создать новую
A fusion of pictures and fabrics on a wall creates a stunning collage of art. Electric blue petals, flowers, and paper products add a unique touch to the facade AIG50
Коллекция по умолчанию
Коллекция по умолчанию
Создать новую
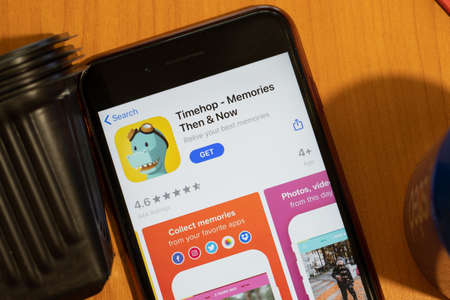
New York, USA - 15 May 2020: Timehop mobile app logo on phone screen, close-up icon, Illustrative Editorial.
Коллекция по умолчанию
Коллекция по умолчанию
Создать новую

Kharkov, Ukraine - February 22, 2021: Apple iPhone with Discord app on screen, application for talk over voice, banner and copy space photo
Коллекция по умолчанию
Коллекция по умолчанию
Создать новую
03-22-2021 Portsmouth, Hampshire, UK A mobile phone or cell phone laid on a wooden table with the Bayern Munich app open on screen
Коллекция по умолчанию
Коллекция по умолчанию
Создать новую
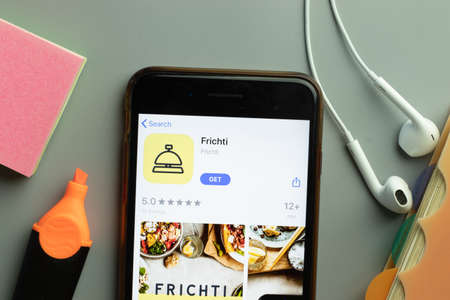
New York, USA - 1 December 2020: Frichti mobile app icon on phone screen top view, Illustrative Editorial.
Коллекция по умолчанию
Коллекция по умолчанию
Создать новую
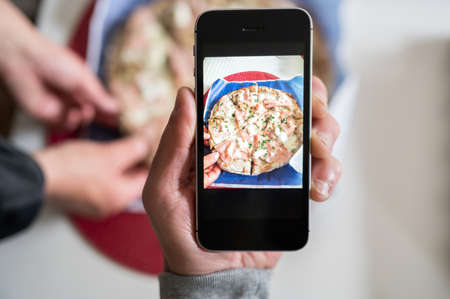
Young man an taking photo with smart phone of a pizza during a friends meal.Copy space
Коллекция по умолчанию
Коллекция по умолчанию
Создать новую

A close-up of a vision board with inspiring photos, goals, and a 'Dream Big' sign pinned to it
Коллекция по умолчанию
Коллекция по умолчанию
Создать новую
KHARKOV, UKRAINE - FEBRUARY 14, 2021: Clubhouse app in app store market on ipad display screen. Clubhouse is invitation only audio chat iPhone app launched in April 2020
Коллекция по умолчанию
Коллекция по умолчанию
Создать новую
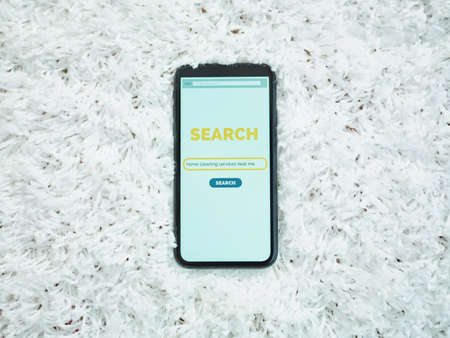
Upper view of smartphone with cleaning service search screen on carpet.
Коллекция по умолчанию
Коллекция по умолчанию
Создать новую
Belorechensk, Russia - March 1, 2021: Clubhouse application view on the smartphone and digital tablet and earphones. Top view flat lay
Коллекция по умолчанию
Коллекция по умолчанию
Создать новую
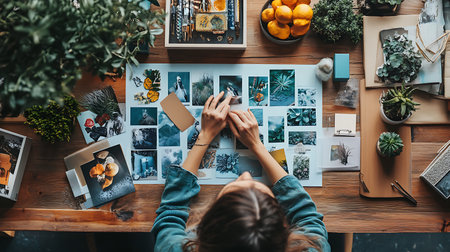
A woman is sitting at a table with a variety of pictures and plants. She is working on a collage, arranging the pictures and plants in a visually appealing way
Коллекция по умолчанию
Коллекция по умолчанию
Создать новую
Lod, Israel - July 8, 2020: Adobe Photoshop Express Photo Editor app play store page on the display of a black mobile smartphone isolated on white background. Top view flat lay with copy space.
Коллекция по умолчанию
Коллекция по умолчанию
Создать новую
Paris, France - Apr 16, 2020: Lots to love less to spend starting at 399 USD Apple Computers internet website on iPad Pro tablet in room environment showcasing new iPhone SE phone
Коллекция по умолчанию
Коллекция по умолчанию
Создать новую
USA - May, 2020; CocaCola Iphone Screen on colored background. #CocaCola
Коллекция по умолчанию
Коллекция по умолчанию
Создать новую

Clubhouse application view on the smartphone, controversy 2021 that hides behind the Social app. Clubhouse drop in audio chat application view on the smartphone
Коллекция по умолчанию
Коллекция по умолчанию
Создать новую
Helsinki, Finland, January 28, 2020: Tik Tok application icon on Apple iPhone 11 screen close-up in woman hands. Tik Tok icon. tik tok application. Tiktok Social media network. Social media icon
Коллекция по умолчанию
Коллекция по умолчанию
Создать новую

Huge amount of pictures from various locations in a collage. Generative AI illustration
Коллекция по умолчанию
Коллекция по умолчанию
Создать новую
Embark on a digital journey into the heart of nature.
Коллекция по умолчанию
Коллекция по умолчанию
Создать новую

Sankt-Petersburg, Russia, January 11, 2018: Apple iMac with Tumblr homepage on monitor screen. Homepage of Tumblr.com on PC computer. Tumblr is microblogging and social networking service.
Коллекция по умолчанию
Коллекция по умолчанию
Создать новую

LONDON, UK - AUGUST 7TH 2017: The homepage of the official website for Uber - the operator of the Uber car transportation mobile app, on 7th August 2017.
Коллекция по умолчанию
Коллекция по умолчанию
Создать новую

TikTok logo app on the screen iPhone with MacBook closeup. TikTok is app to create and share videos. Moscow, Russia - November 18, 2020
Коллекция по умолчанию
Коллекция по умолчанию
Создать новую

03-22-2021 Portsmouth, Hampshire, UK A mobile phone or cell phone being held in a hand with the Odeon Cinema app open on screen
Коллекция по умолчанию
Коллекция по умолчанию
Создать новую

Delhi, India, 2020. Woman installing TikTok mobile app on a smartphone screen with out of focus laptop in the background depicting logo of popular fast growing social network site. Concept shot viral
Коллекция по умолчанию
Коллекция по умолчанию
Создать новую

WROCLAW, POLAND - August, 29th 2020: Hand holds TikTok logo over another social media symbols. TikTok is a Chinese video-sharing social networking service
Коллекция по умолчанию
Коллекция по умолчанию
Создать новую

Bangkok, Thailand - April 17, 2020: Hand holding tablet with N or Netflix logo on dark background on red background. Netflix is famous global provider of streaming movies and series.
Коллекция по умолчанию
Коллекция по умолчанию
Создать новую
Picture of couple in phone. Sad man looking at photos of woman. Husband longing and missing wife. Memories of happy family. Upset boyfriend or widow.
Коллекция по умолчанию
Коллекция по умолчанию
Создать новую
September 5, 2019 Ukraine, Boryspil Airport - Photo exhibition Swedish Fathers - Creative photos about fathers and children
Коллекция по умолчанию
Коллекция по умолчанию
Создать новую
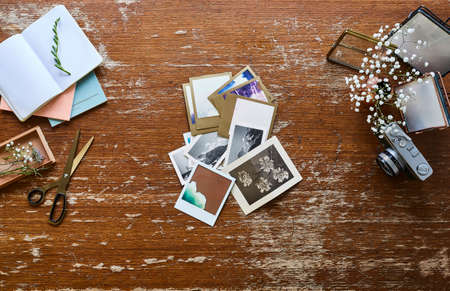
creative workspace photographer sorting vintage pictures
Коллекция по умолчанию
Коллекция по умолчанию
Создать новую

BELGRADE, SERBIA - MARCH 9, 2020: The New York Times web site on computer screen in Belgrade, Serbia. It is an American daily newspaper, founded and continuously published in New York City since September 18, 1851
Коллекция по умолчанию
Коллекция по умолчанию
Создать новую
Lod, Israel - July 8, 2020: Adobe Capture - Vector & Pattern Maker app launch screen with logo on the display of a black mobile smartphone isolated on white background. Top view flat lay with copy space.
Коллекция по умолчанию
Коллекция по умолчанию
Создать новую

Vilnius, Lithuania - June 1 2020: Stop Covid, Immuni App, official COVID-19 or Coronavirus contact tracing app for Italy, Europe, Italian Government? S exposure notification solution, tracking system
Коллекция по умолчанию
Коллекция по умолчанию
Создать новую
Zoom app logo on the screen smartphone closeup. Zoom Video Communications is a company that provides remote conferencing services.
Коллекция по умолчанию
Коллекция по умолчанию
Создать новую


